Using CaseWide

Contents
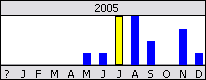
The CaseWide timeline has scales that display at both ends of the graph. These scales are determined by finding the bar representing the greatest number of facts and then rounding up to the next logical scale value. For example, if the tallest bar represents 93 facts, the top scale value would round to 100.
For optimal viewing, CaseWide's fact bars have a minimum height, but that does not mean the data calculated is the same for each bar. Two bars with the same height may represent different numbers of facts. Be certain to click on each bar to display a popup of the number of facts for each. Only time periods with a fact bar are included in the average calculation.
The CaseWide graph has a minimum display height of half an inch, but you can drag the split bar down to increase viewing size.
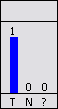
CaseWide also includes a separate graph to track Fuzzy month and day calculations with a status of To Be Determined, Not Applicable, and Unknown? for fact records. This graph displays at the far right of the CaseWide timeline. These bars are labeled T, N, and ?, respectively. And although the bars scale independently from the bars in the principal CaseWide timeline, they do scale relative to each other. To open/close the graph display, click the T N ? button.
The CaseWide timeline now displays at the top of the Facts spreadsheet.
The selected fact bar turns yellow and a popup displays the number of facts records for the month or day.
Click on a fact bar to display a popup of the number of facts for each. Double-click on a fact bar to display the records in a list dialog box that you can print.
The Date Navigator box allows you to jump to a specific date in your case timeline by selecting a particular day, month, and year. You can also use the scroll bar below the timeline to navigate dates.
|