An evaluation field is a fixed-list type of CaseMap field that staff can use to assign assessment scores to facts, questions, research and other types of information. Evaluation fields can be used in several spreadsheets, as described in the following table:
User Roles and Evaluation Fields
Only you or a scribe user signed in as you can assign values to evaluation fields you have created. However, other authors and scribes not signed in as you can show Evaluation fields you created in their spreadsheet views and see assignments you have made to individual records. Additionally, the Fact Dashboard bar charts can be filtered to show any evaluation fields added by staff to the Facts spreadsheet. For more information, see: Fact Dashboard.
Evaluation Fields in Case Assessment
When applied to facts, Evaluation fields can play an important role in enabling advanced case assessment capabilities. If evaluation fields are consistently applied to facts, and when facts are also linked to important issues, you can use the Facts Dashboard to monitor the strength of your case as indicated by an evaluation of the facts. For more information, see: Fact Dashboard.
| 1. | In the CASE SHORTCUTS pane, select the spreadsheet you want to add the field to (e.g., Facts). |
| 2. | Right click a column header where you want the field to appear, then select Insert Fields. |
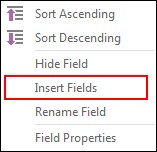
The Select Field(s) To Insert dialog box opens.
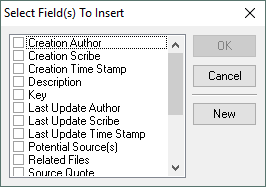
| 3. | Click New.
The New Field dialog box opens.
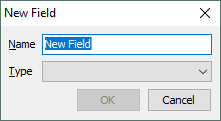 |
| 4. | Type a descriptive, unique name for the field. |
| 5. | In the Type field, select Evaluation, and then click OK. |
The new field is added to the list and selected by default.
| 6. | Click OK.
The evaluation field is added to the spreadsheet and is ready to use. |
|
| 1. | Open the spreadsheet that contains the Evaluation field for records you want to work with. |
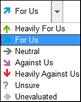
| 2. | Click the Evaluation field cell of the record you want to evaluate, then select a value for the record.
|

|
If you are unsure which file is an Evaluation field, an easy way is to check the record details for any record in the spreadsheet. For more information, see the next procedure in this topic.
|
|
| 1. | Open the spreadsheet that contains the Evaluation field for records you want to work with. |
| 2. | Select the record you want to evaluate. |
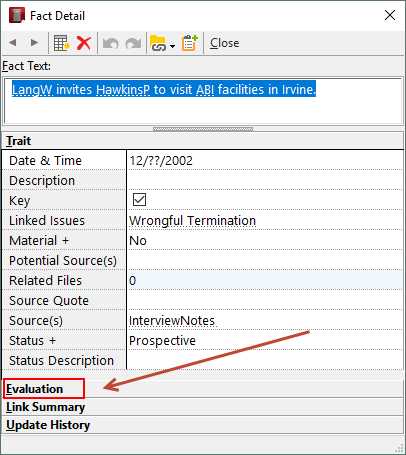
| 3. | On the HOME Tab, click Detail.
The detail dialog box for the record opens.
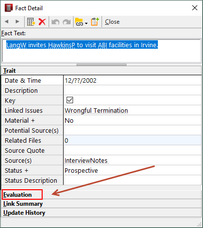 |
| 4. | Click the Evaluation bar.
All Evaluation fields that exist for the record are listed. |
| 5. | Select evaluation values for the record. |
| 6. | Do either of the following: |
| • | To go back to the spreadsheet view, click Close. |
| • | To evaluate the next or previous record, click the next or previous record (arrow) button on the toolbar.
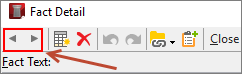 |
|
| 1. | On the HOME tab, select Fact Cards. |
| 2. | Select the Evaluation tab. |
| 3. | Expand Unevaluated Facts. |
| 4. | Drag cards by the top of the card to evaluation categories in the left panel.
For more information on using Fact Cards, see: . |
|
You can run search filters, apply tags, and sort based on values in the Evaluation fields. For example, you can filter the Facts spreadsheet to show only highly rated facts.
Right-click on the Evaluation field and then select Sort Ascending or Sort Descending. For example, you can sort the Questions spreadsheet based on question criticality so that the most important questions in your case are listed first.
|
|
CaseMap allows you to have many independent evaluations of each fact, object, issue, question, and authority in a case. Use the Evaluation Comparison box to explore the similarities and differences among evaluations. The evaluation comparison process works identically for facts, objects, issues, and questions.
The results of evaluation comparisons display in a matrix, comparing the values of one evaluation and the columns display with the values of another. Green matrix cells are where evaluations being compared are identical. Red matrix cells are where the evaluations being compared differ. Once you know where the similarities and differences exist, you can review the specifics behind the analysis.
| 1. | In the Case Shortcuts pane, click on the icon for the spreadsheet you want to use. |
| 2. | On the Records menu, click Evaluation Comparison. |
| 3. | In the Evaluation Comparison box, click on an evaluation field in the A drop-down listing. |

| 4. | In the B drop-down listing, click on another evaluation field. |
| 5. | Click Compare to view the matrix results. |
| 6. | Point to a cell to read a summary of results in the bottom left of the CaseMap status bar. |

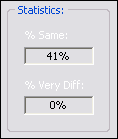
Review the comparison display on the right side of the box. There you will find scores of evaluation symbols that are the same or very different.
| 7. | Double-click in a cell to view source detail. |

|
If you are running a filter, you can choose whether to base your evaluation comparison on the entire set of elements of just on those elements that have survived the filter operation. Check the Apply Filter box in the Evaluation Comparison box to include filters in the comparison. You may want to try running the comparison both ways to view any differences.
|
|
As a case analysis progresses, you have setup issues, and you have categorized and applied evaluations to facts, you can check your progress by using the bar charts in the Facts Dashboard. If you have more than one evaluation field applied to facts, you can switch between fields to see how different team members have evaluated the very same facts.
| 1. | Select the Facts spreadsheet. |
| 2. | On the HOME tab, click Fact Dashboard. |
| 3. | In the bar charts area, click the list selector, then select the evaluation field you want to see results for. |
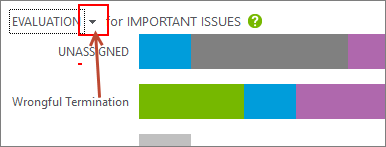
The bar charts represent counts of facts assigned to important issues with evaluations forming bar chart regions.
| • | To see a popup showing fact counts for each issue, point to bar charts. ]
|
|